Analytics and Reports: the ten-minute habit
Analytics shows the trend at a glance; Reports pulls specific numbers with Run report.
Plan: All plansWho: Owners and admins
The Analytics tab shows you the shape of your business at a glance; the Reports tab pulls specific numbers when you need them.
Analytics: the glanceable stuff#
Open Analytics for charts of how the business is trending — bookings and revenue over time, so you can see the season building (or not) without exporting anything.
Reports: the specific stuff#
 Tap to enlarge
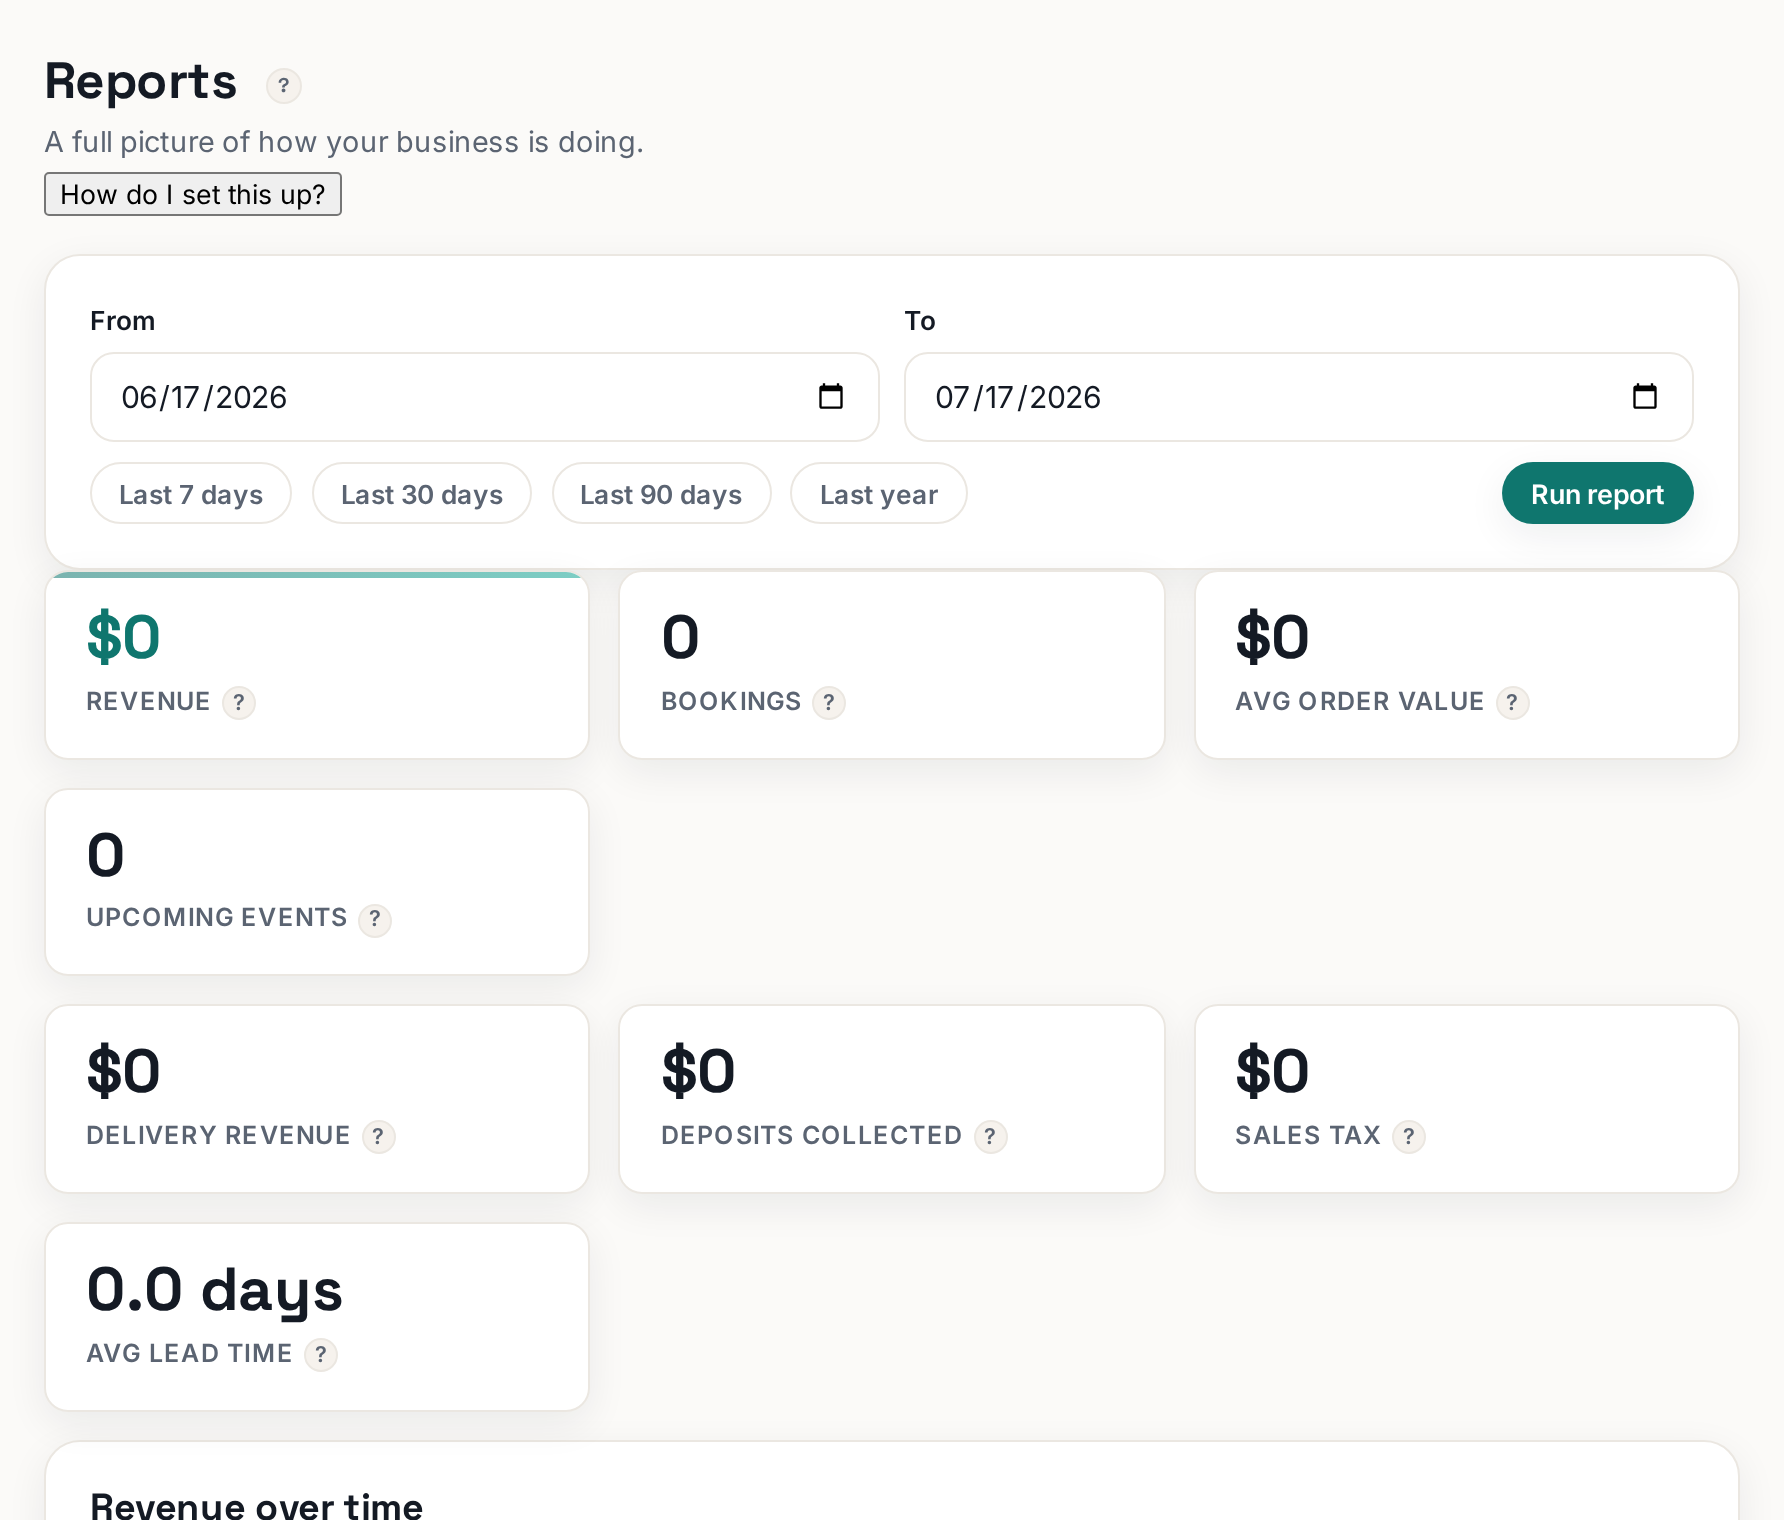
Open Reports, pick the report and date range, and click Run report. The two workhorses:
- Revenue over time — what you earned, period by period. Use it for spotting your true peak weeks and for tax-time sanity checks.
- Top customers — who spends the most with you. These are the people who deserve a loyalty discount and a Christmas card.
Most reports can then be exported with Export CSV for your accountant or a spreadsheet.
A monthly habit worth having#
Once a month: run Revenue over time, glance at Top customers, and ask one question — what should I buy more of? The answer is usually visible within ten minutes.
★
Numbers look off? Check the date range first — an accidentally short range is the usual culprit.
More in Account, team & plan
Can my staff or drivers have their own login?Yes — invite by email and pick a role. (Pro feature.)Do you provide a rental agreement? How do signatures work?You supply the terms — we handle the signing and storage.How do I cancel? Do I lose my data?Cancel any time from Plan & Billing. No contract.Is my data safe? Can other rental companies see it?No. Every business is isolated at the database level.Is there a mobile app?Yes — install Rennt to your home screen. It works like an app.